


ABSTRACT
Television continues to evolve from pure consumptive linear viewing to web-like interactive experiences. Emerging new applications, such as multi-screen discovery, consumption, and network DVR, all allow and support user interaction.
This is possible due to the evolution of TV application architectures from dedicated hardware-centric functionality to a combination of hardware appliances controlled by modular software services.
Big Data technologies can support these rich, interactive TV experiences by collecting, storing, and analysing federated events and creating usable information for end-consumers, operators, and programmers.
This paper provides an application’s view into how Big Data enables insight from user behaviour, network / appliance operations, and content analysis.
INTRODUCTION – INTERSECTION OF TV & BIG DATA
Overview of Big Data
The advent of the Internet and the resulting volume of data that needs to be managed, stored, and analysed led to the emergence of modern day Big Data technologies.
Yahoo and Google developed breakthrough technologies on processing Internet scale data and storing the processed results on distributed commodity servers to enable high availability and scalability.
Google File System (GFS) [4] and Big Table [5] showcase early pioneering work that was developed for storing data.
This is the precursor to some of the mainstream, open source big data related technologies that have been developed and evolved by the open source community like Apache. Apache HBase [6] and Apache Hadoop Distributed File System (HDFS) [7] are open source equivalents of Big Table and GFS respectively.
A typical Big Data technology stack is comprised of an event intake layer facilitating the input of multi-formatted information from a variety of sources, and a core Hadoop eco-system for storing and processing collected information.
Analysis of the collected data provides meaningful understanding and insight through dashboards, reports or application-facing interfaces.
TV – Sources for Big Data
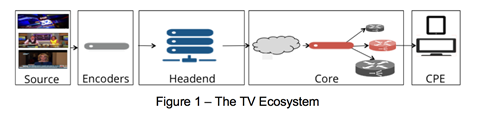
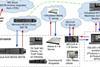
The end-to-end TV ecosystem is a complex audio and video delivery system that carries source multimedia content that is encoded and distributed to a head-end. Within the head- end, the content is further manipulated or formatted for delivery to users on their customer premise equipment (CPE) device via the core network.
This end-to-end functionality can be logically thought of as a vertical decomposition into application, control, video, and network layers.
Instrumenting these various layers allows access to rich information that can be harnessed by Big Data. Client-facing applications resident on a CPE device or a web-application can be instrumented to collect user interaction and content consumption information.
This provides insight into user behaviour. An instrumented control plane, used for managing subscribers and creating network centric applications such as nDVR and targeted ad insertion, can help drive operational understanding and efficiencies.
Instrumented video and network layers provide insight into sub-program information, appliance operation (encoders, network recorders, packagers, and delivery) and network QoS.
DERIVING INSIGHT FOR EMERGING TV SERVICES
Quantifying User Interaction
Instrumented client applications, whether they are on traditional CPE or multi-screen devices, help quantify user interaction behaviour. They enable measuring traditional events like user navigation, content discovery, session start, tuner change, and direct interaction during content play.
It is also possible to analyse the collected events to ascertain more abstract and aggregated consumption behaviour such as program popularity by geographic region.
Event monitoring and tracking systems facilitate user interaction logging in an unprecedented way. Keeping in mind user privacy concerns, known hashing and security techniques are employed to protect subscriber anonymity and provide data security.
Even in this form, meaningful operational and content utilisation information can be determined for prescriptive and predictive purposes. Some examples of the types of analyses include number of active users at any given date and time, program/channel popularity, channel tuning persistence rates, and recorded content peak playback statistics.
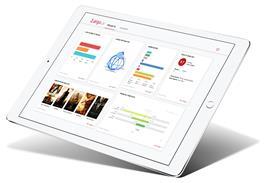
This information itself is operationally useful and is typically presented via dashboards and reports.
Collecting and analysing subscribers’ consumption and usage is an essential step in creating targeted experiences.
Consumer-facing applications and services may also access actionable information for individual subscribers through defined interfaces, allowing customised user experiences and applications.
Subscriber consumption patterns can be supplemented with appropriate subscriber profile information accessed through APIs to filter and construct customised application views for each user.
DOWNLOAD THE FULL TECH PAPER BELOW
Downloads
Bhavan gandhi “tv insights – application of big data to television”
PDF, Size 0.47 mb


No comments yet