Home
Watch
IBC2026
IBC Daily
Log in
Enter keywords
Submit search
Watch
IBC2026
IBC Daily
Accelerating Innovation
Accelerating Innovation
IBC Accelerators
Tech Papers Hub
Intellectual property
Artificial Intelligence
Artificial Intelligence
AI Audio
AI Post-Production
Deep Fakes & Digital Replicas
Ethics
GenAI
Machine Learning
Scraping & Training
Connective Tech
Connective Tech
5G
6G
Cloud
Digital Audio Workstation
Edge Computing
IP Workflows
Network Slicing
IBC Show
IBC Show
IBC2024
IBC2023
IBC2025
Immersive Tech
Immersive Tech
AR
Immersive Audio
Metaverse
MR
Spatial Computing
Volumetric Video
VR
XR
OTT & Streaming
OTT & Streaming
AVOD
CDNs
FAST
SVOD
TVOD
People & Purpose
People & Purpose
Acquisition & Retention
Diversity, equity & inclusion
Skills & Training
Sustainability
Production
Production
Audio Tech
Camera Tech
Content Acquisition
IP Production
LED Volumes
Live Production
Outside Broadcast (OB)
Remote Production
Sports Production
Storytelling
Studio Production
Virtual Production
Virtual Production
Camera Tracking
Worldbuilding
Motion Capture & Performance
Rendering & Compositing
Robotic Cameras
Enter keywords
Submit search
Production
Live Production
Topics:
Audio Tech
Camera Tech
Content Acquisition
IP Production
LED Volumes
Live Production
Outside Broadcast (OB)
Remote Production
Sports Production
Storytelling
Studio Production
Choose a topic
Audio Tech
Camera Tech
Content Acquisition
IP Production
LED Volumes
Live Production
Outside Broadcast (OB)
Remote Production
Sports Production
Storytelling
Studio Production
View other themes:
CHOOSE THEME
ACCELERATING INNOVATION
ARTIFICIAL INTELLIGENCE
CONNECTIVE TECH
IBC SHOW
IMMERSIVE TECH
OTT & STREAMING
PEOPLE & PURPOSE
VIRTUAL PRODUCTION
News
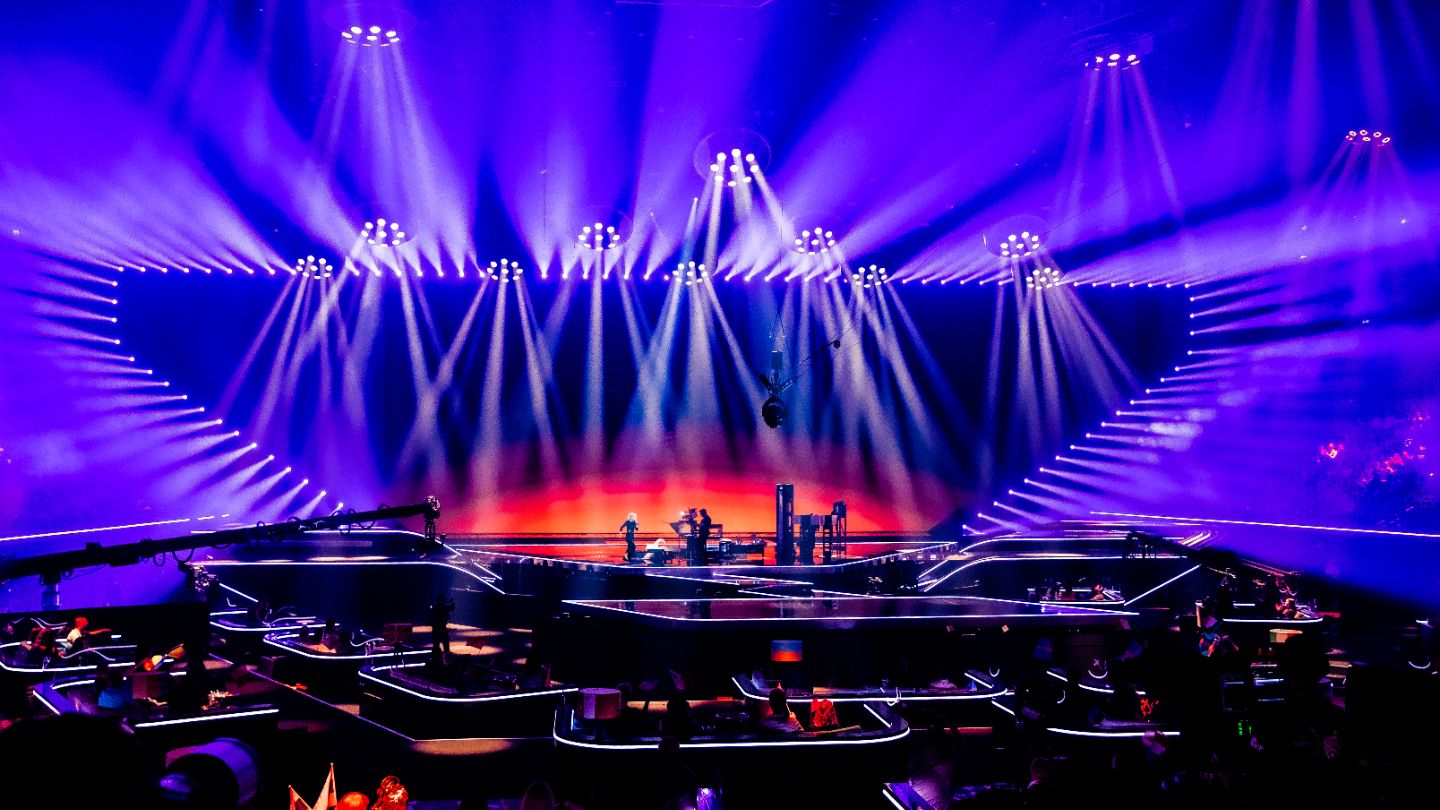
Bangkok to host first-ever Eurovision Song Contest Asia in 2026
Read now
News
Broadcasters call for programmable 5G connectivity
News
DAZN to bring live sports to the skies and seas
News
Black Mirror to come to life in immersive experience
Features
Software studios: How inevitable is fully software-defined production?
News
IBC announces shortlisted 2026 Accelerator projects
News
Yospace says it helps rights-holders claim advertising gold during Milano Cortina
News
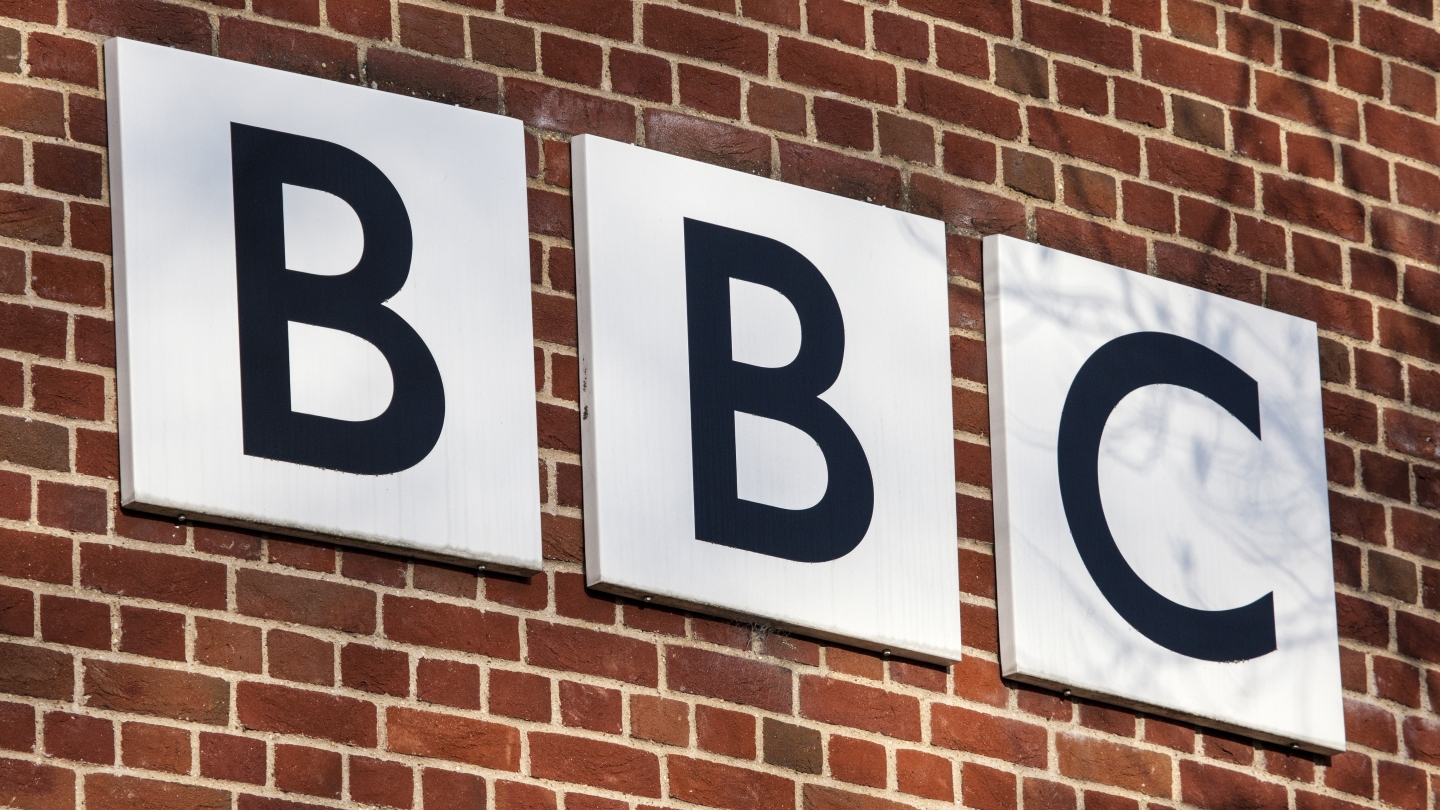
Culture Secretary vows to futureproof BBC with permanent charter
News
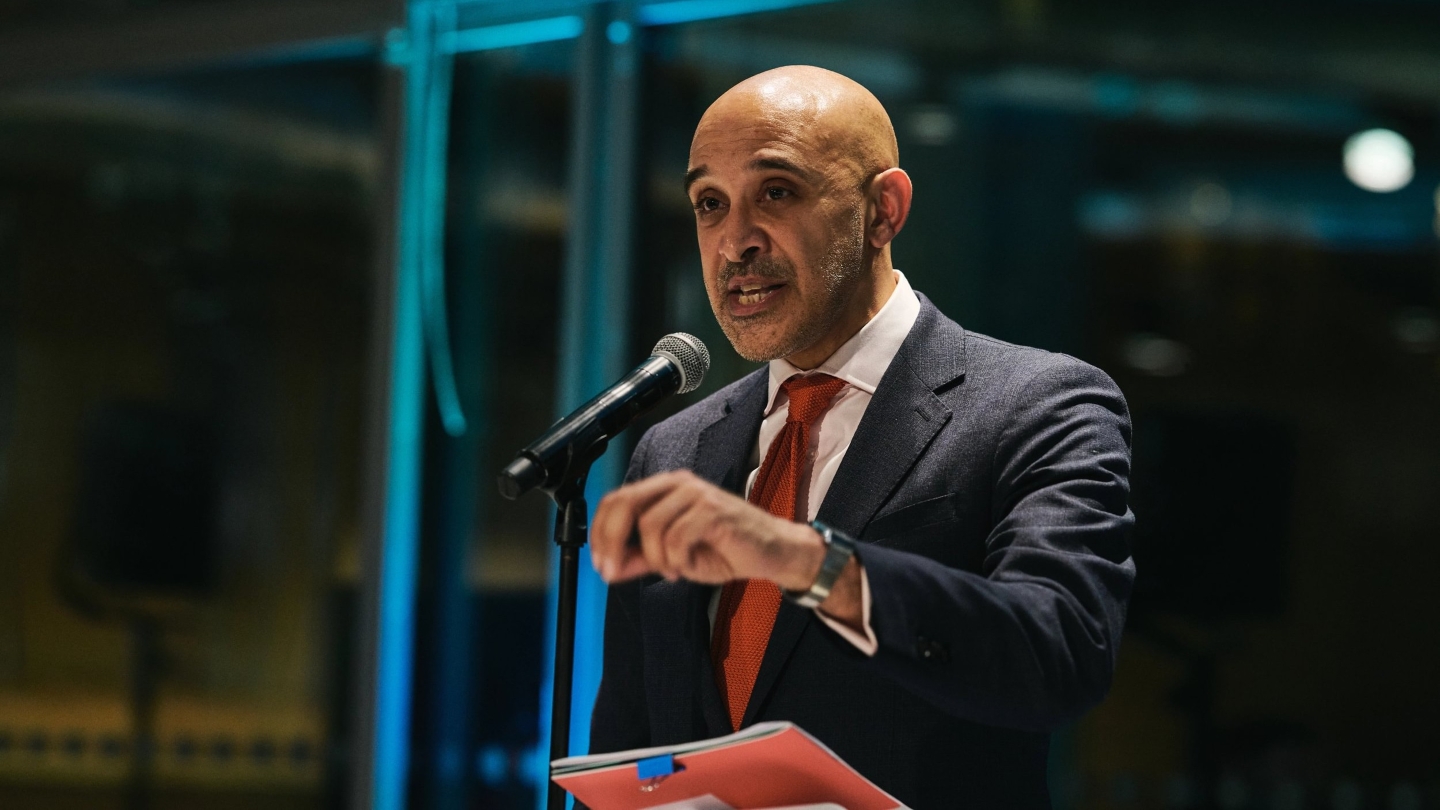
Head of Eurovision broadcaster ORF resigns
News
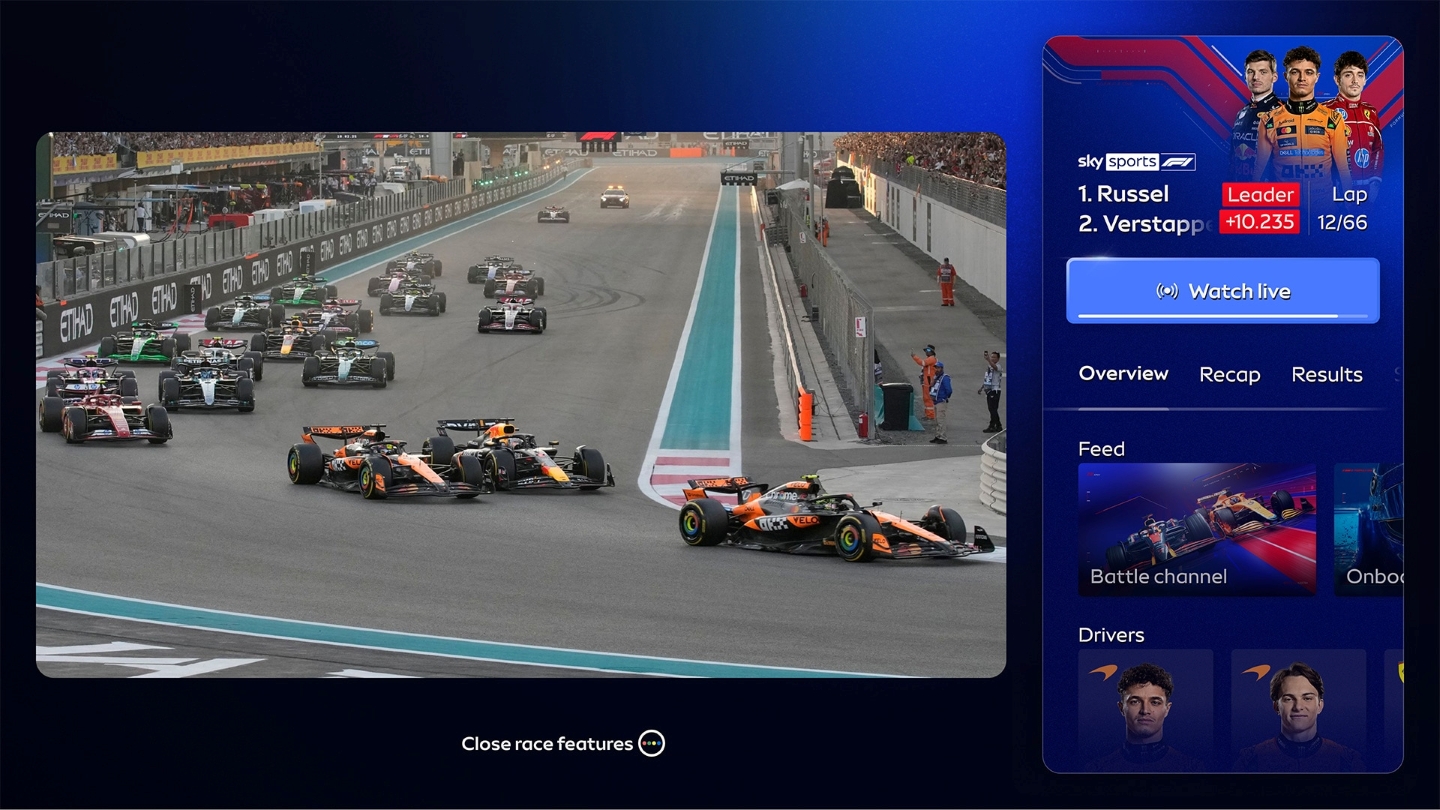
Sky Sports ramps up F1 coverage with immersive sidebar
News
iPlayer open to hosting rival PSBs to survive “permanent and irreversible” disruption
News
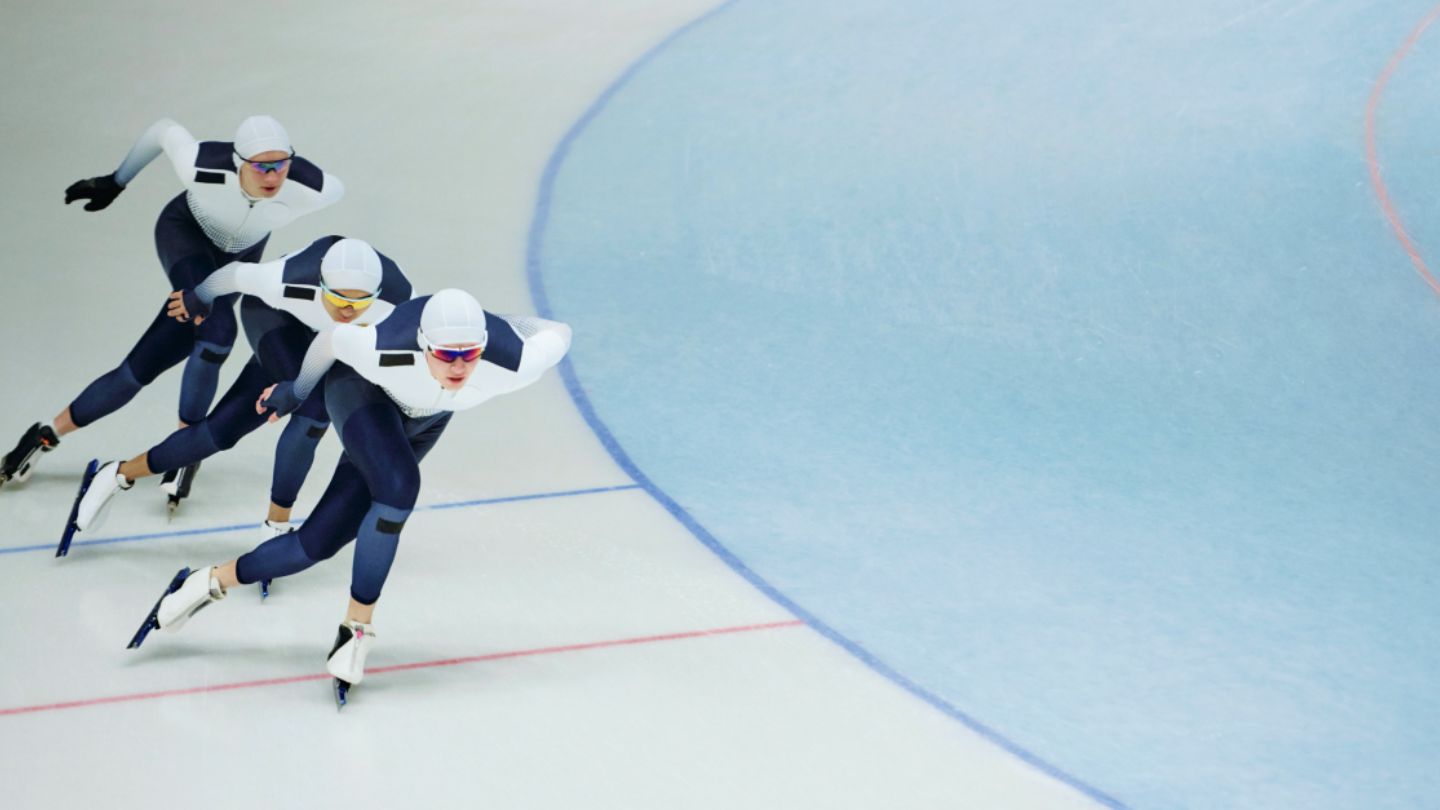
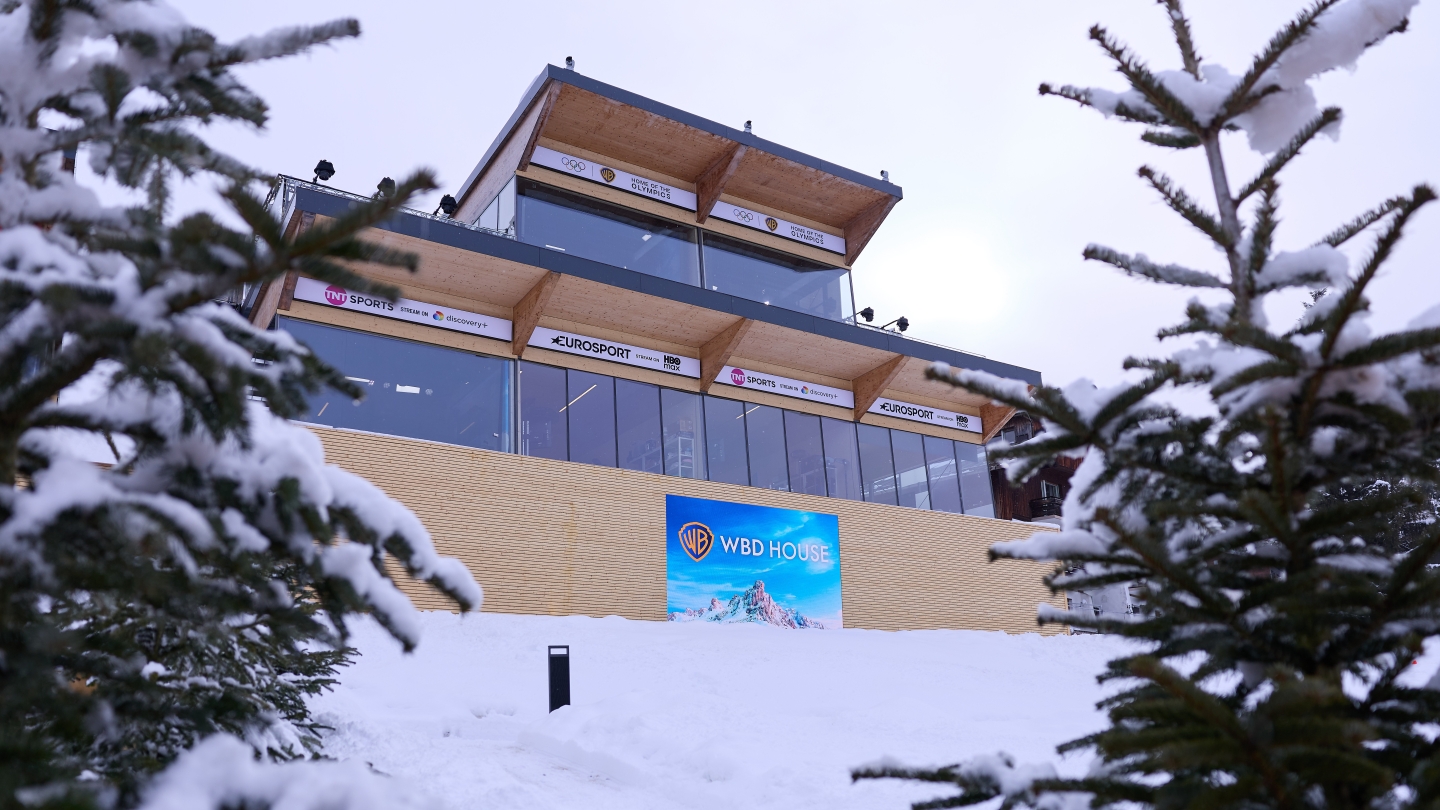
Winter Olympic Games 2026 is most-watched ever for European broadcasters
News
Charity publishes set of principles for mentally healthy productions
News
Warner Bros Discovery and BBC report strong Winter Olympics viewing
News
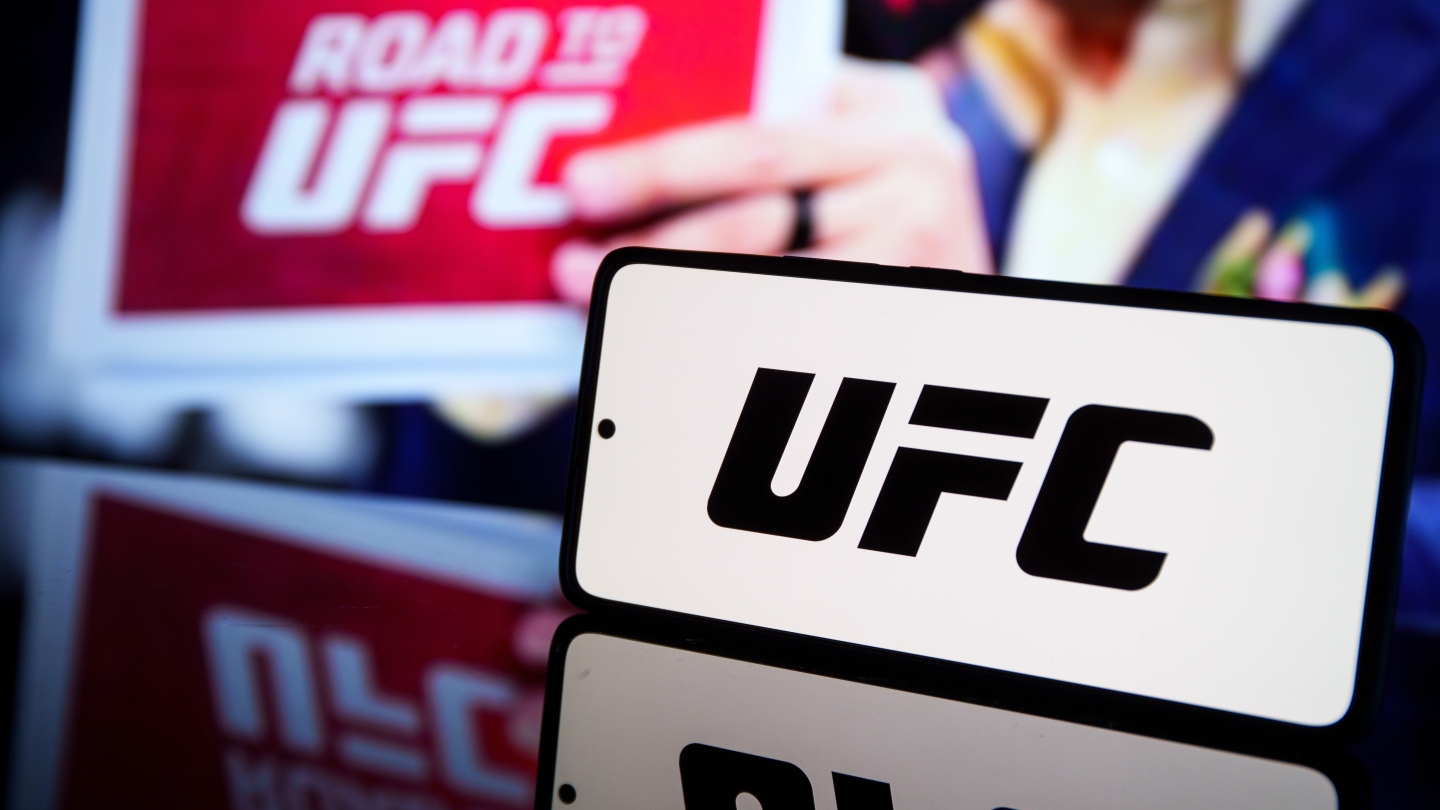
Sports programming surges on major streaming platforms
News
LTN appoints three execs for new tech business
News
Gracenote Data Hub registers strong sports growth
News
Live TV viewing is still ‘substantial’, says Barb
More

.jpg)